Case study · B2B SaaS · Data reliability
Catching broken data before the business does
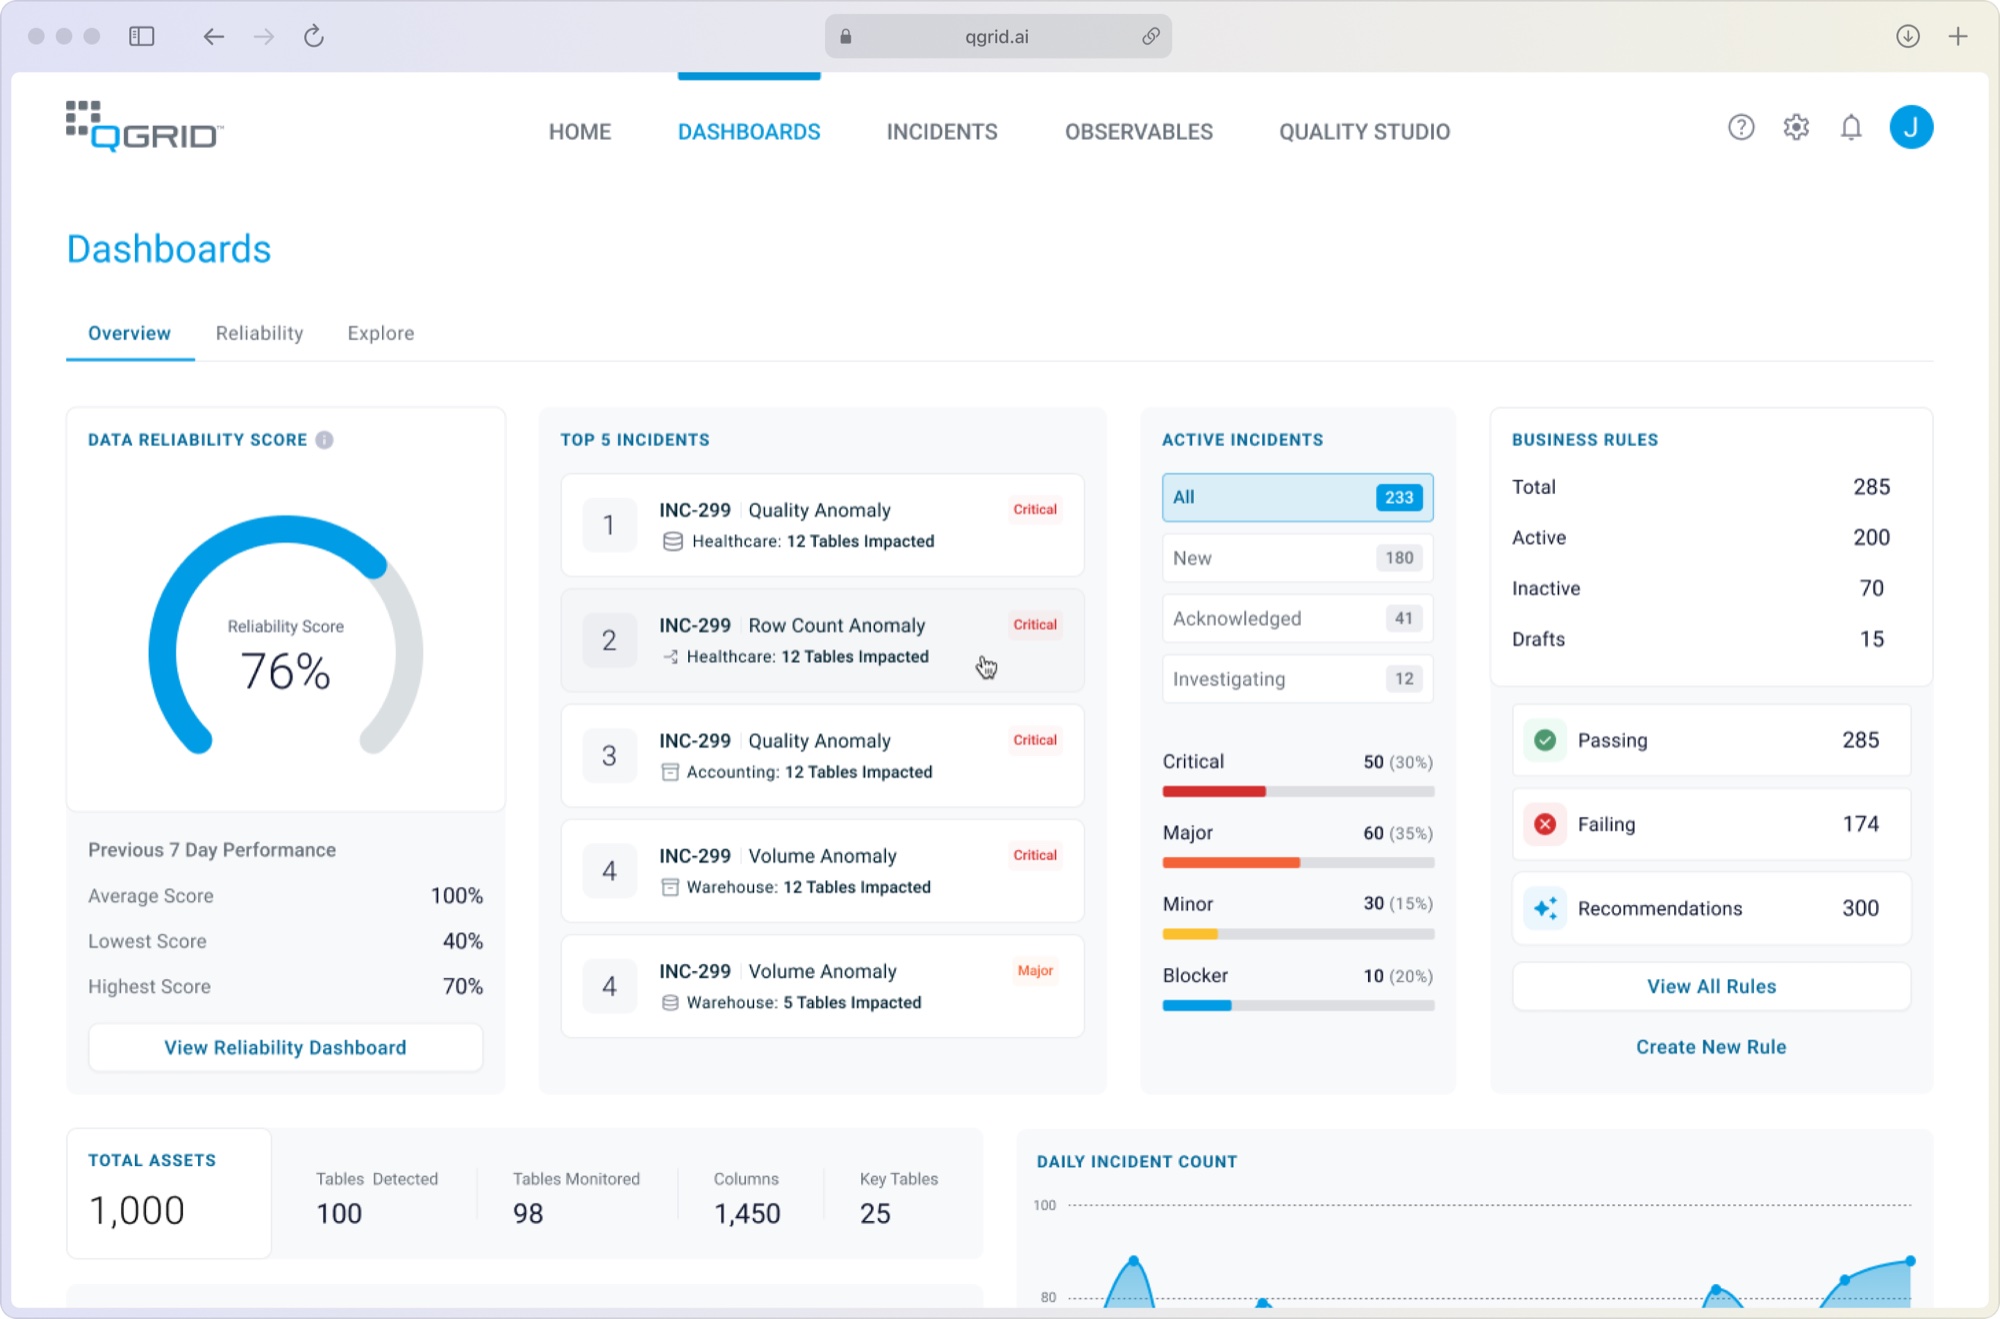
When a pipeline breaks silently, nobody finds out until a report is wrong and a decision has already been made on it. qGrid pairs AI anomaly detection with validation rules written in plain language, so engineers and business teams can see what broke, why, and what it touched.
Problem
Existing tools buried teams in alerts, split the picture across dashboards, and hid every check behind SQL only engineers could read.
Approach
One loop, designed for four roles: define what "correct" means, detect when it isn't, trace the cause, and route it to the right team.
Outcome
In beta, qGrid onboarded the enterprise databases of two Fortune 500 companies.
01
The challenge
Pipelines don't fail loudly. They fail quietly, and someone finds out later
Enterprise data runs through lakes, warehouses and dozens of jobs owned by different teams. When one of them breaks, a column goes null, a load arrives half-empty or a schema changes, and nothing errors. The numbers just drift, and the dashboards built on them go on looking fine.
That's data downtime: hours or days when the business is making decisions on data that's wrong. The design problem was giving technical and business teams one shared view of data health, and a way to act on it, without either side having to learn the other's tools.
02
Strategy
More monitoring wasn't the answer. Less friction was
The tools teams already used produced the same three complaints: alert fatigue, dashboards split across products, and checks written as SQL that only their author could follow. Adding more alerts would only make the problem louder.
So qGrid is built as one loop instead of four separate tools: define what correct data looks like, detect when it drifts, trace where it broke, and route it to whoever can fix it. Every screen had to work for four different people.
- Data engineersNeed to know which job broke and where, fast.
- Analytics engineersNeed checks on the models they build, without hand-writing each one.
- Data stewards & analystsKnow the business rules, but not the SQL to enforce them.
- Enterprise data leadersNeed one honest answer to "can we trust this data?"
03
Define
Write the rule in the language you already know it in
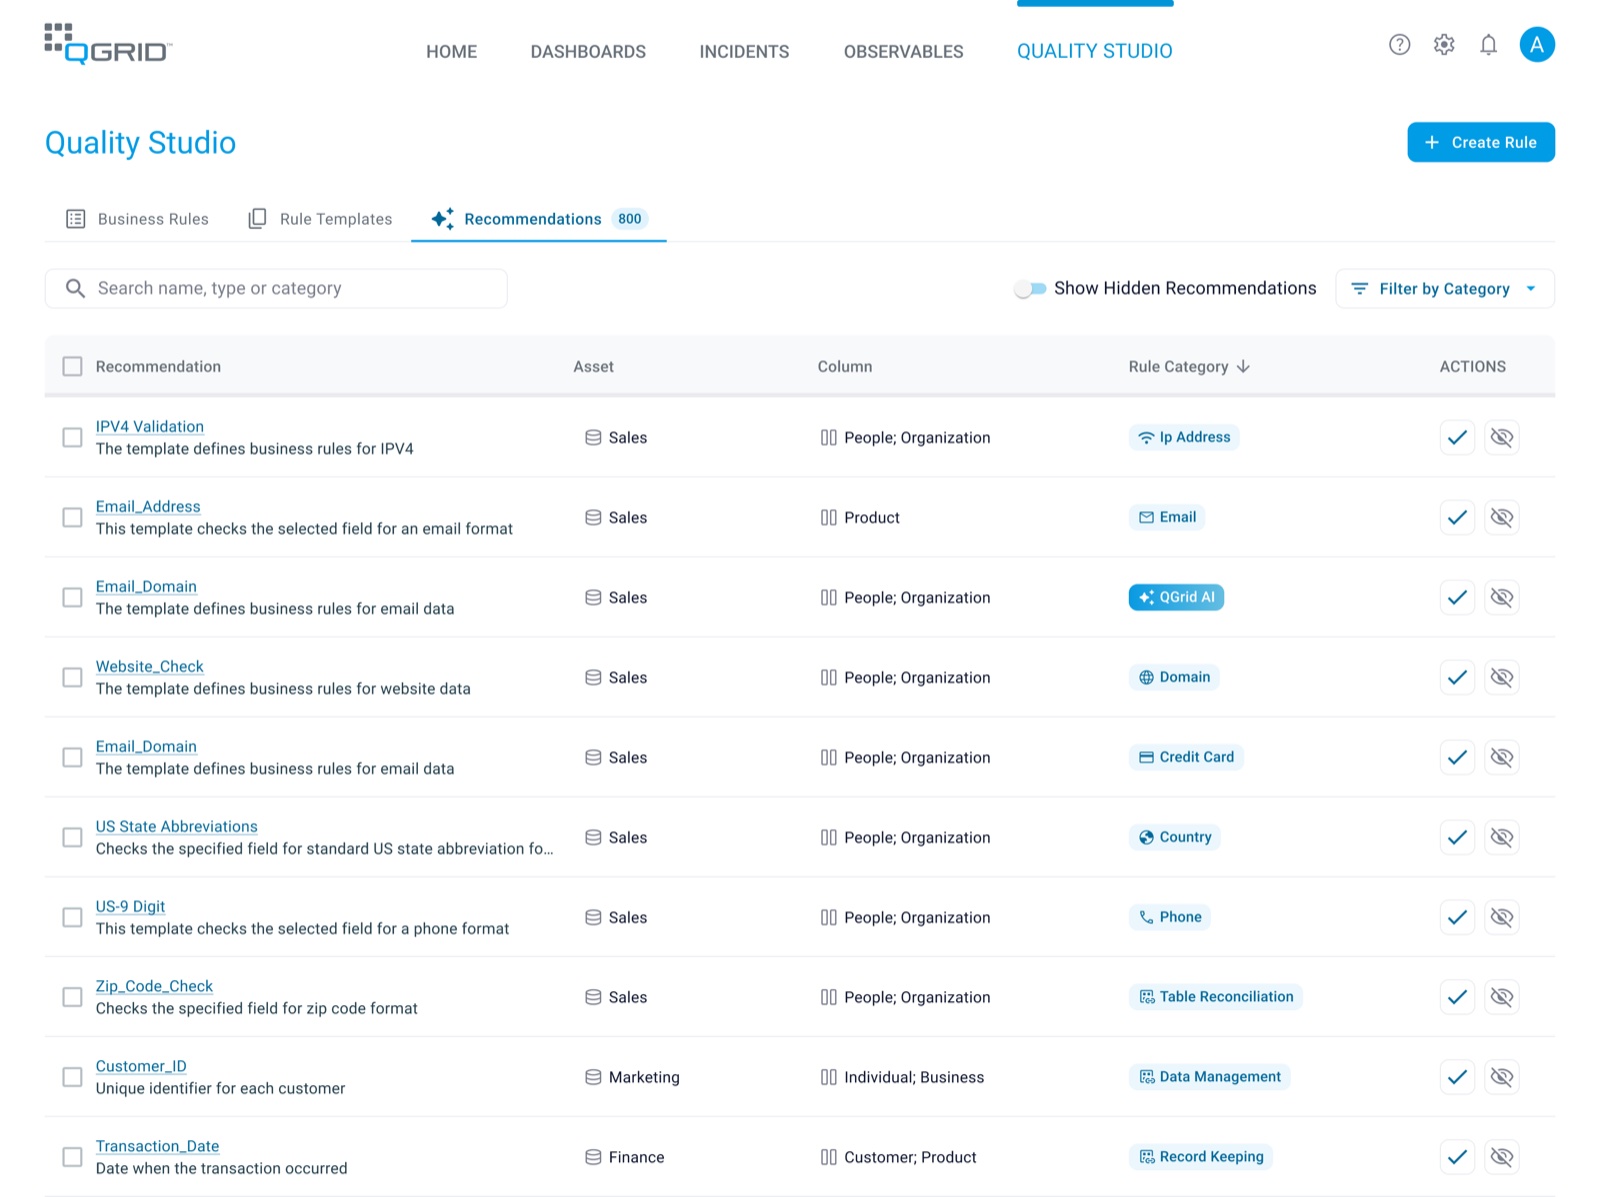
Stewards and analysts know the rules the data has to follow: a zip code has five digits, every order has a customer. What stopped them was the SQL. Quality Studio starts them with recommendations qGrid has already matched to their tables, grouped by category, to accept or hide in one click.
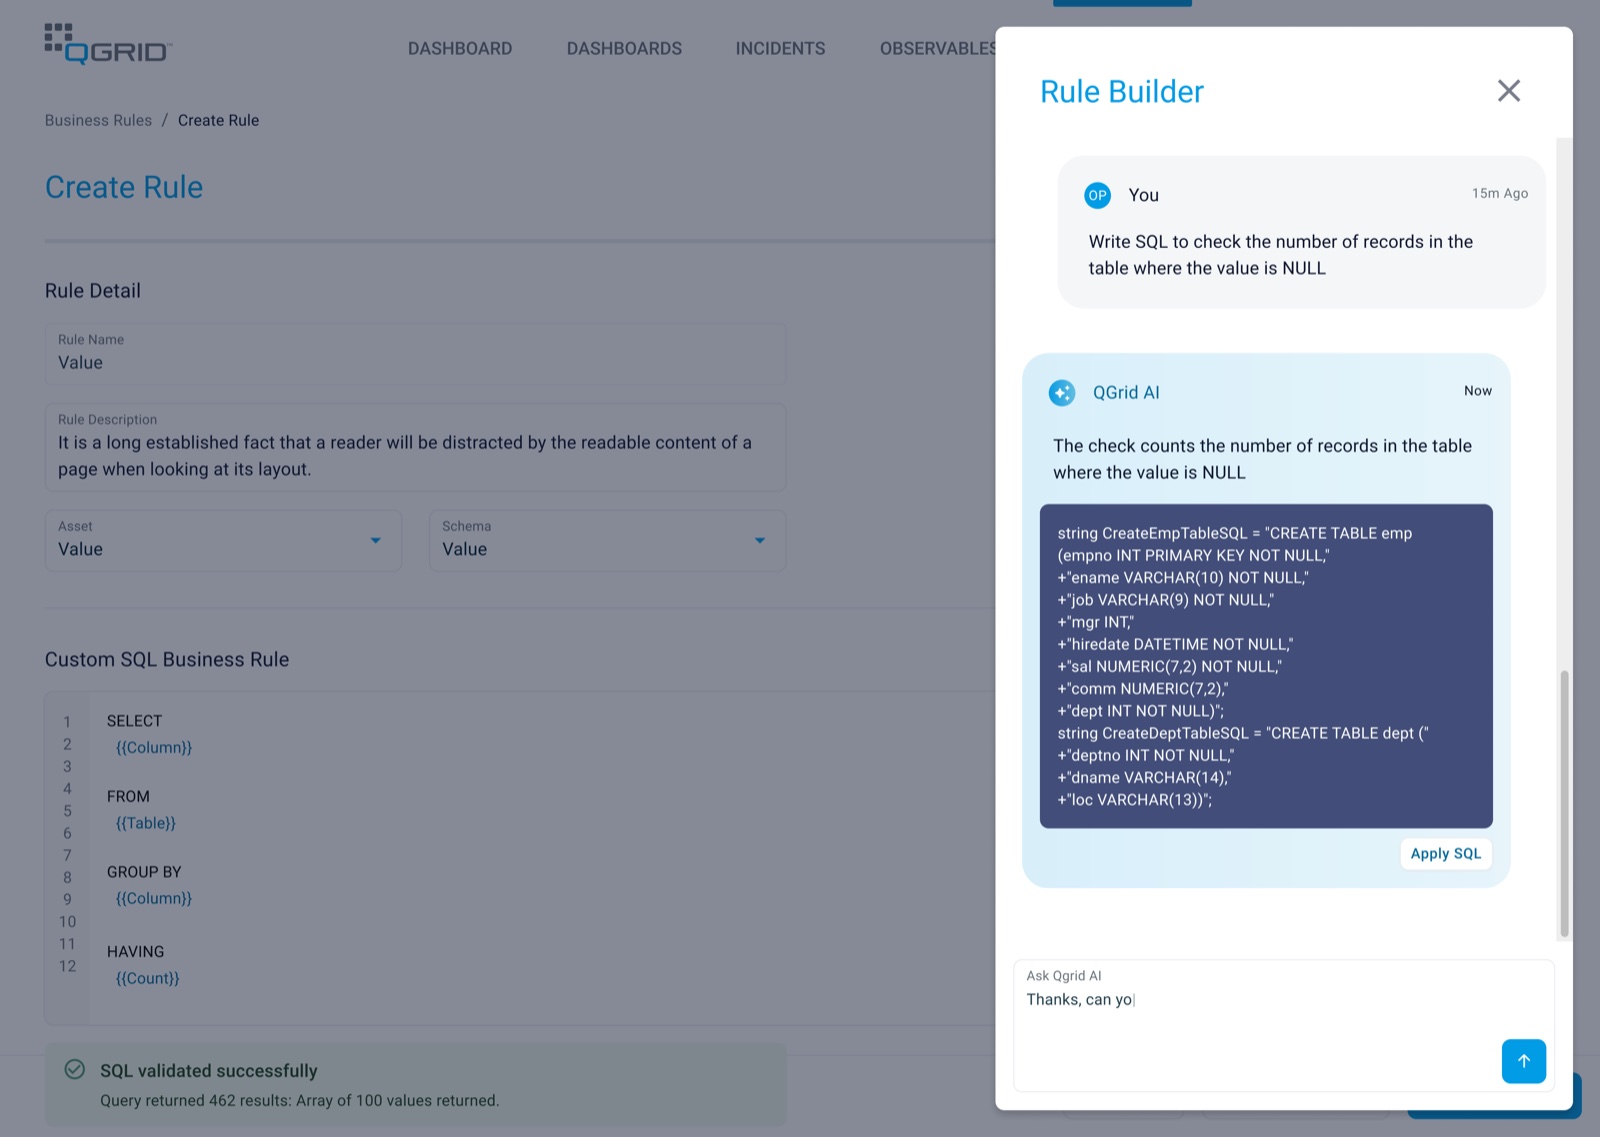
For anything custom, the Rule Builder takes a plain-language request, writes the check, explains what it does, and validates it against real data before it's saved.
04
Detect
Rules cover what you know. The models watch for everything else
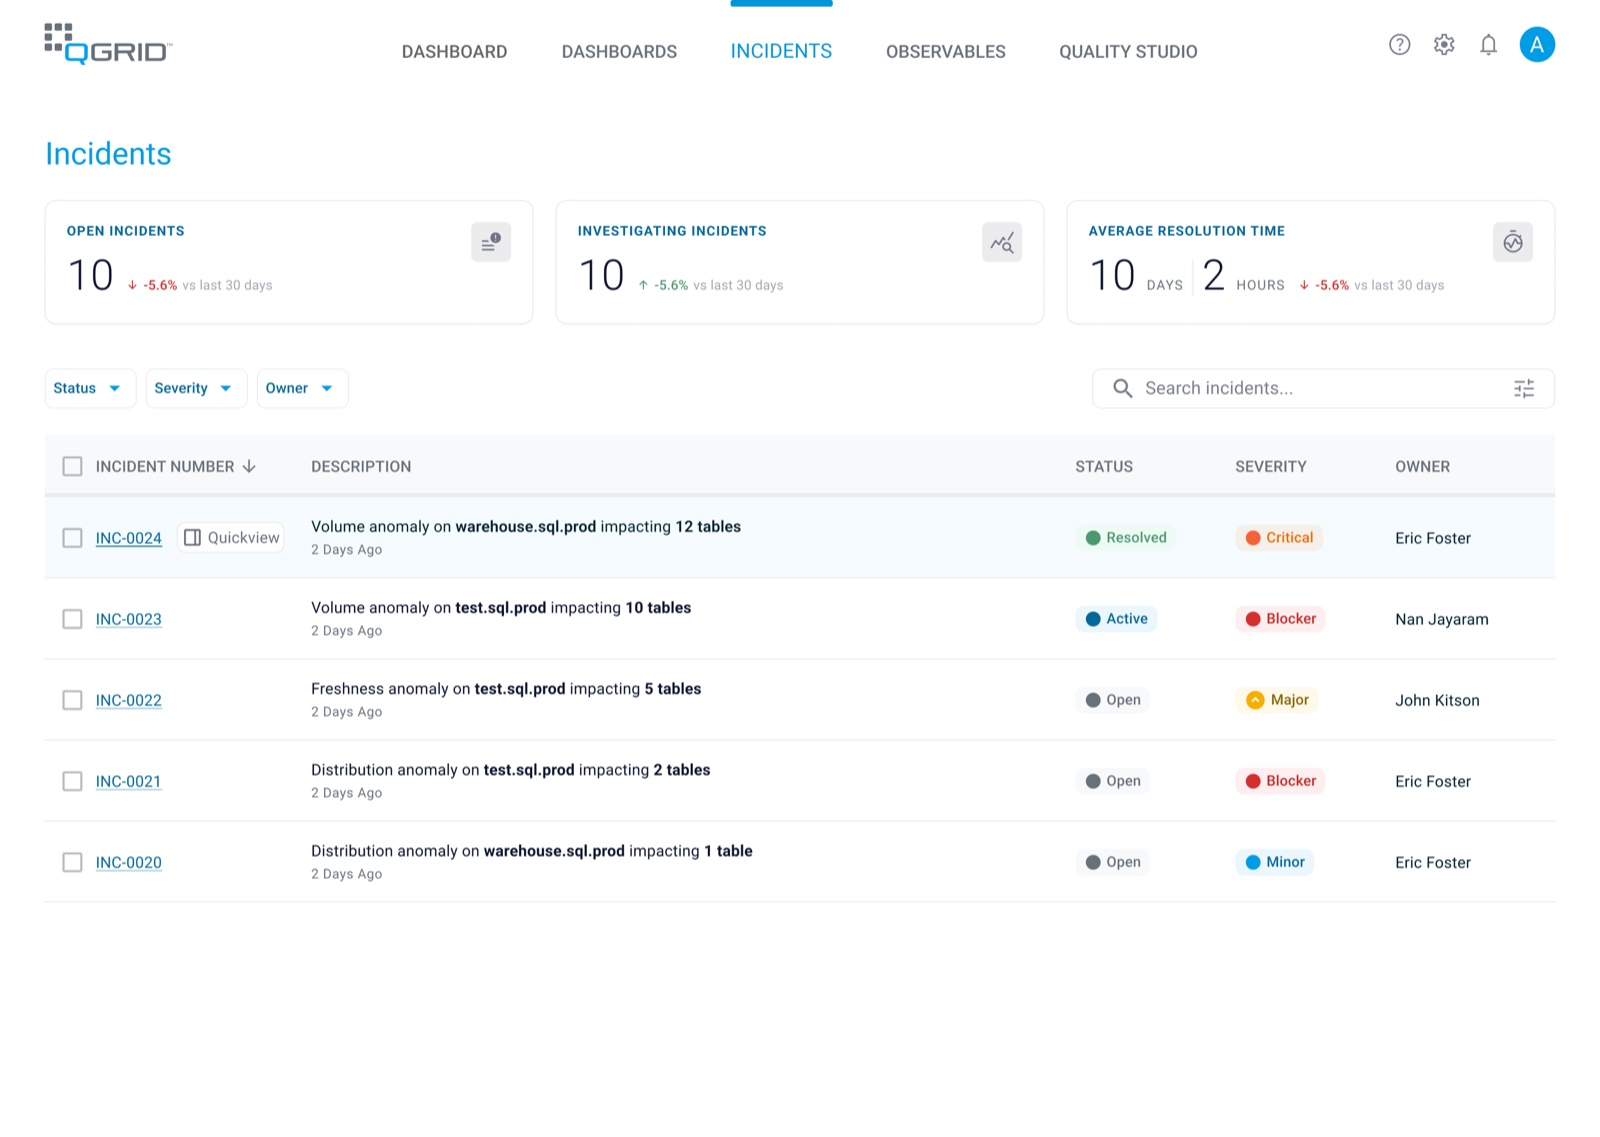
ML models learn each table's normal volume, freshness, schema and distribution, and open an incident when something drifts. The incident list is ranked by severity and says in one line what happened and how many tables it hit, so a team works the worst problem first, not the loudest.
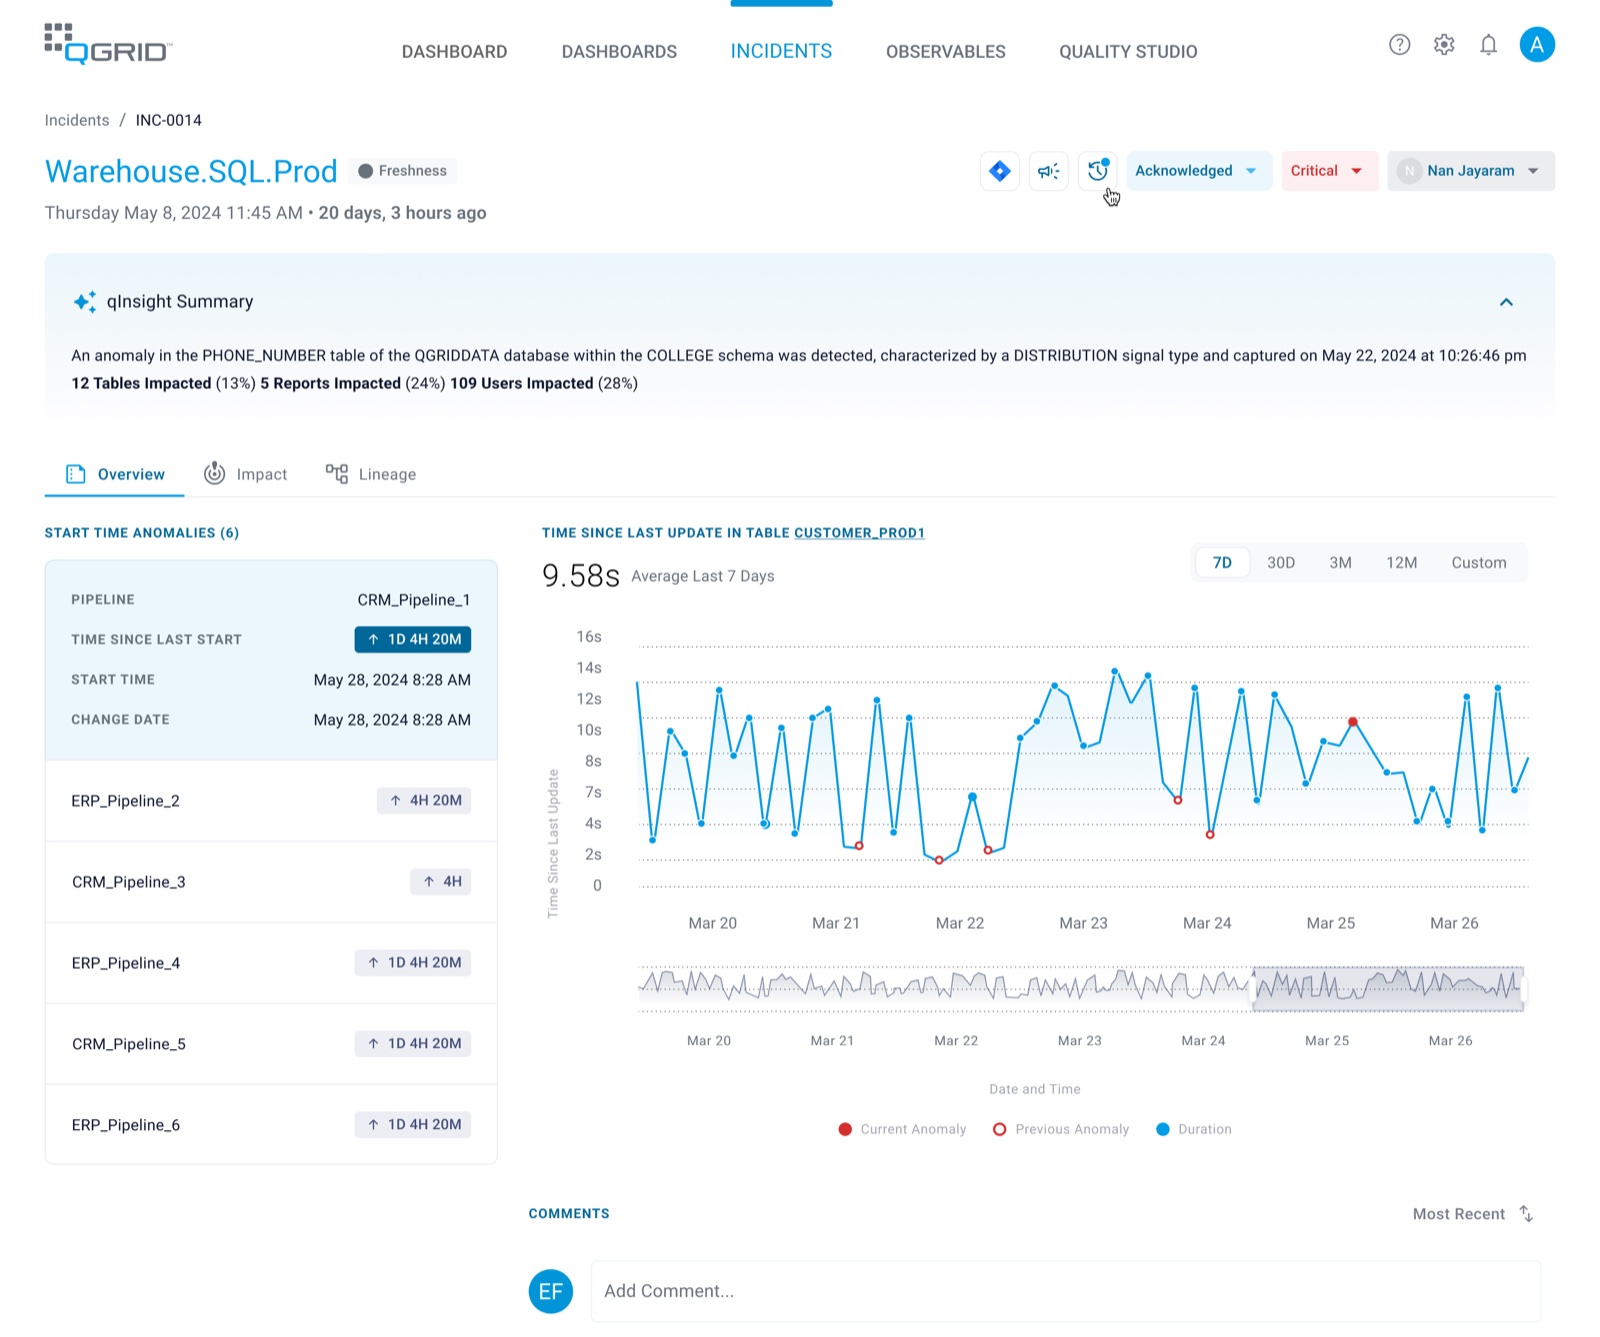
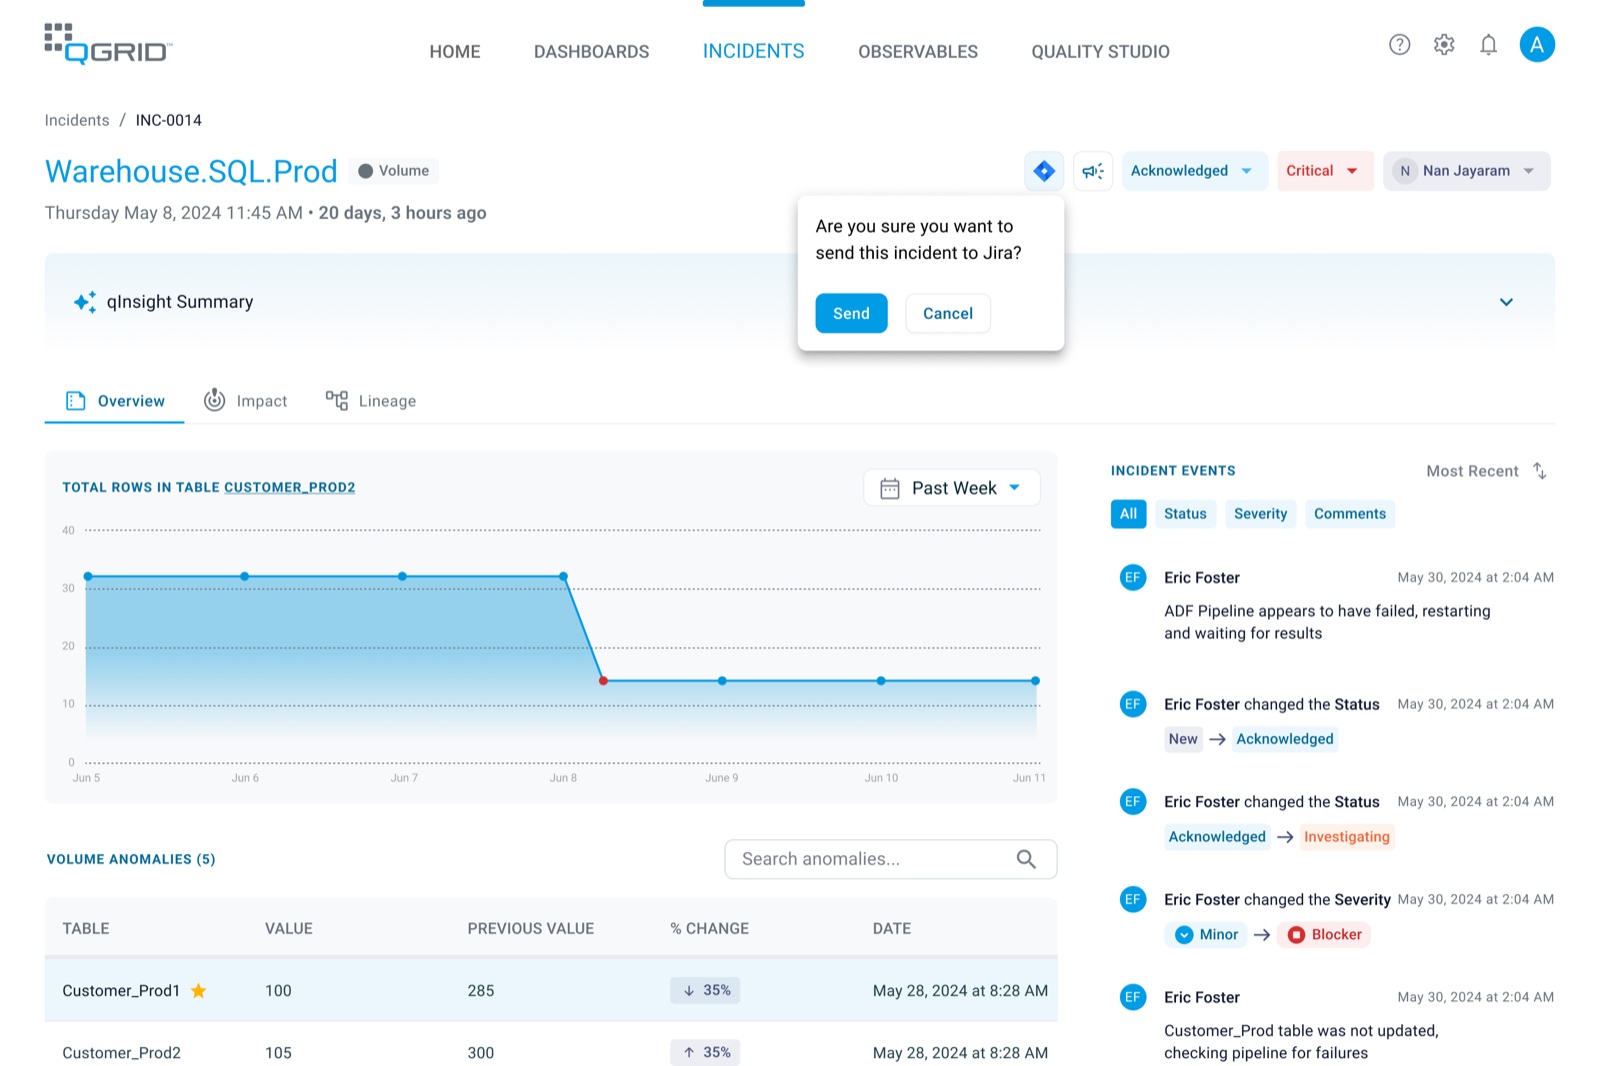
From here the story follows one incident on the Warehouse.SQL.Prod table. Opening it leads with a qInsight summary: the AI's plain-English account of what was detected and how many tables, reports and people it affects, before any chart.
05
Trace
Every incident opens on the path it travelled
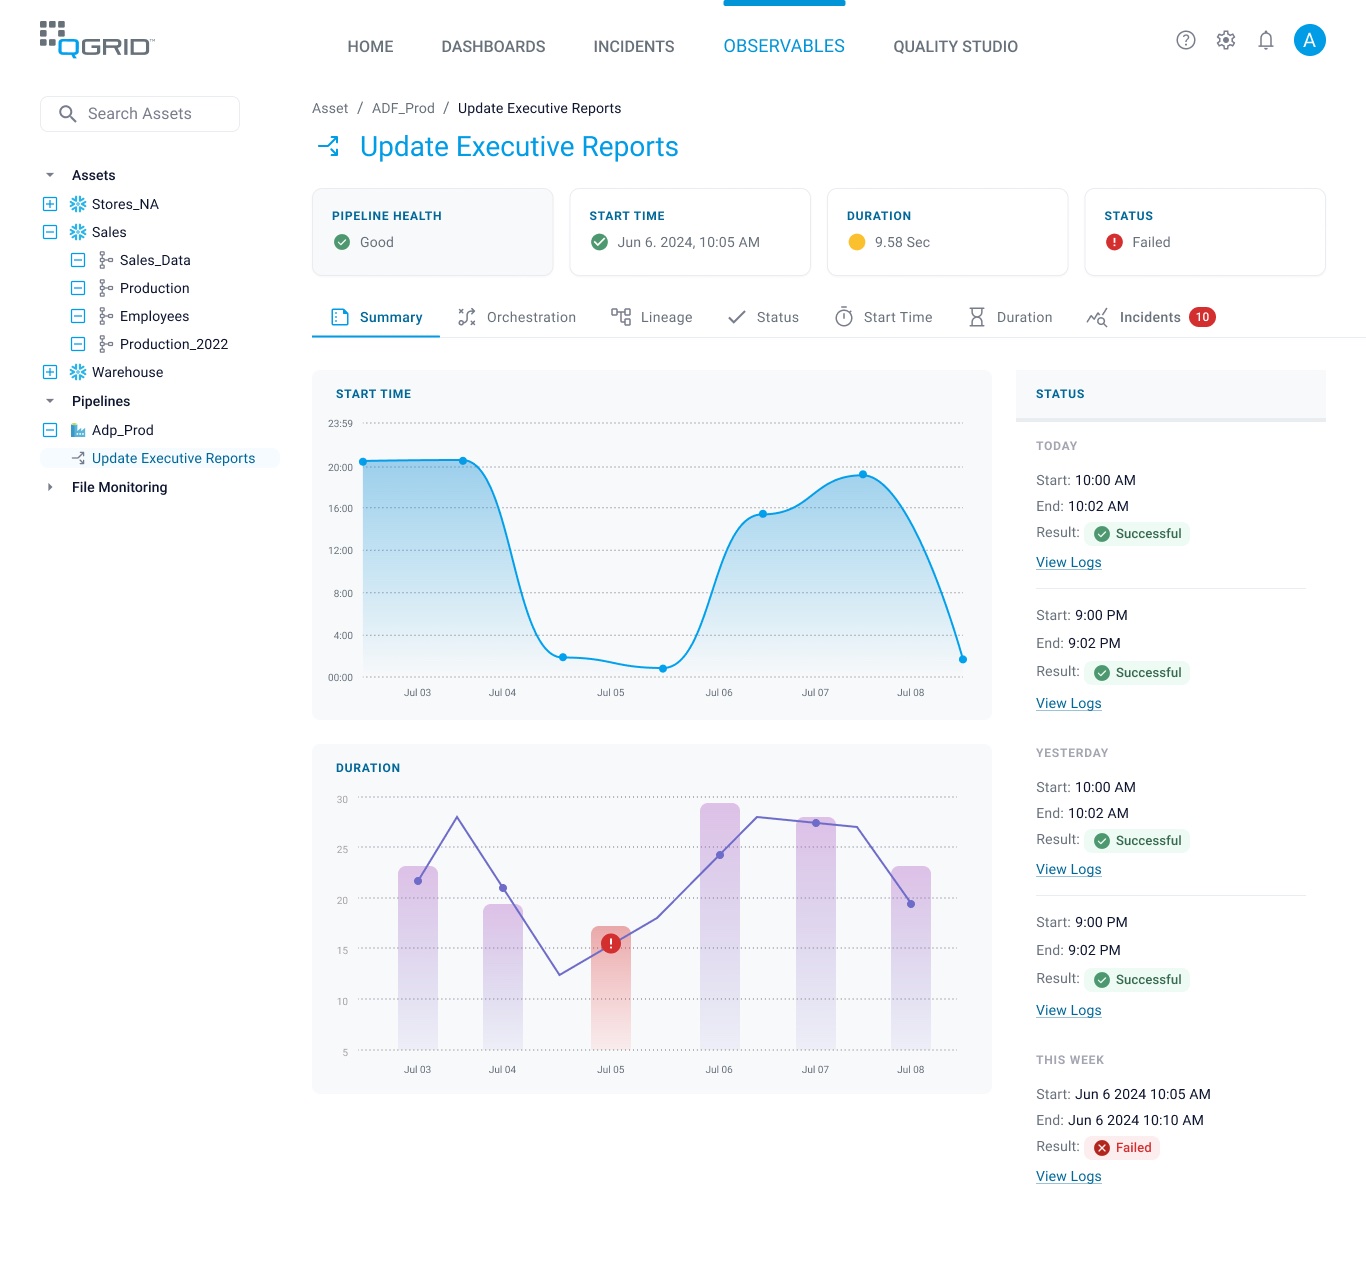
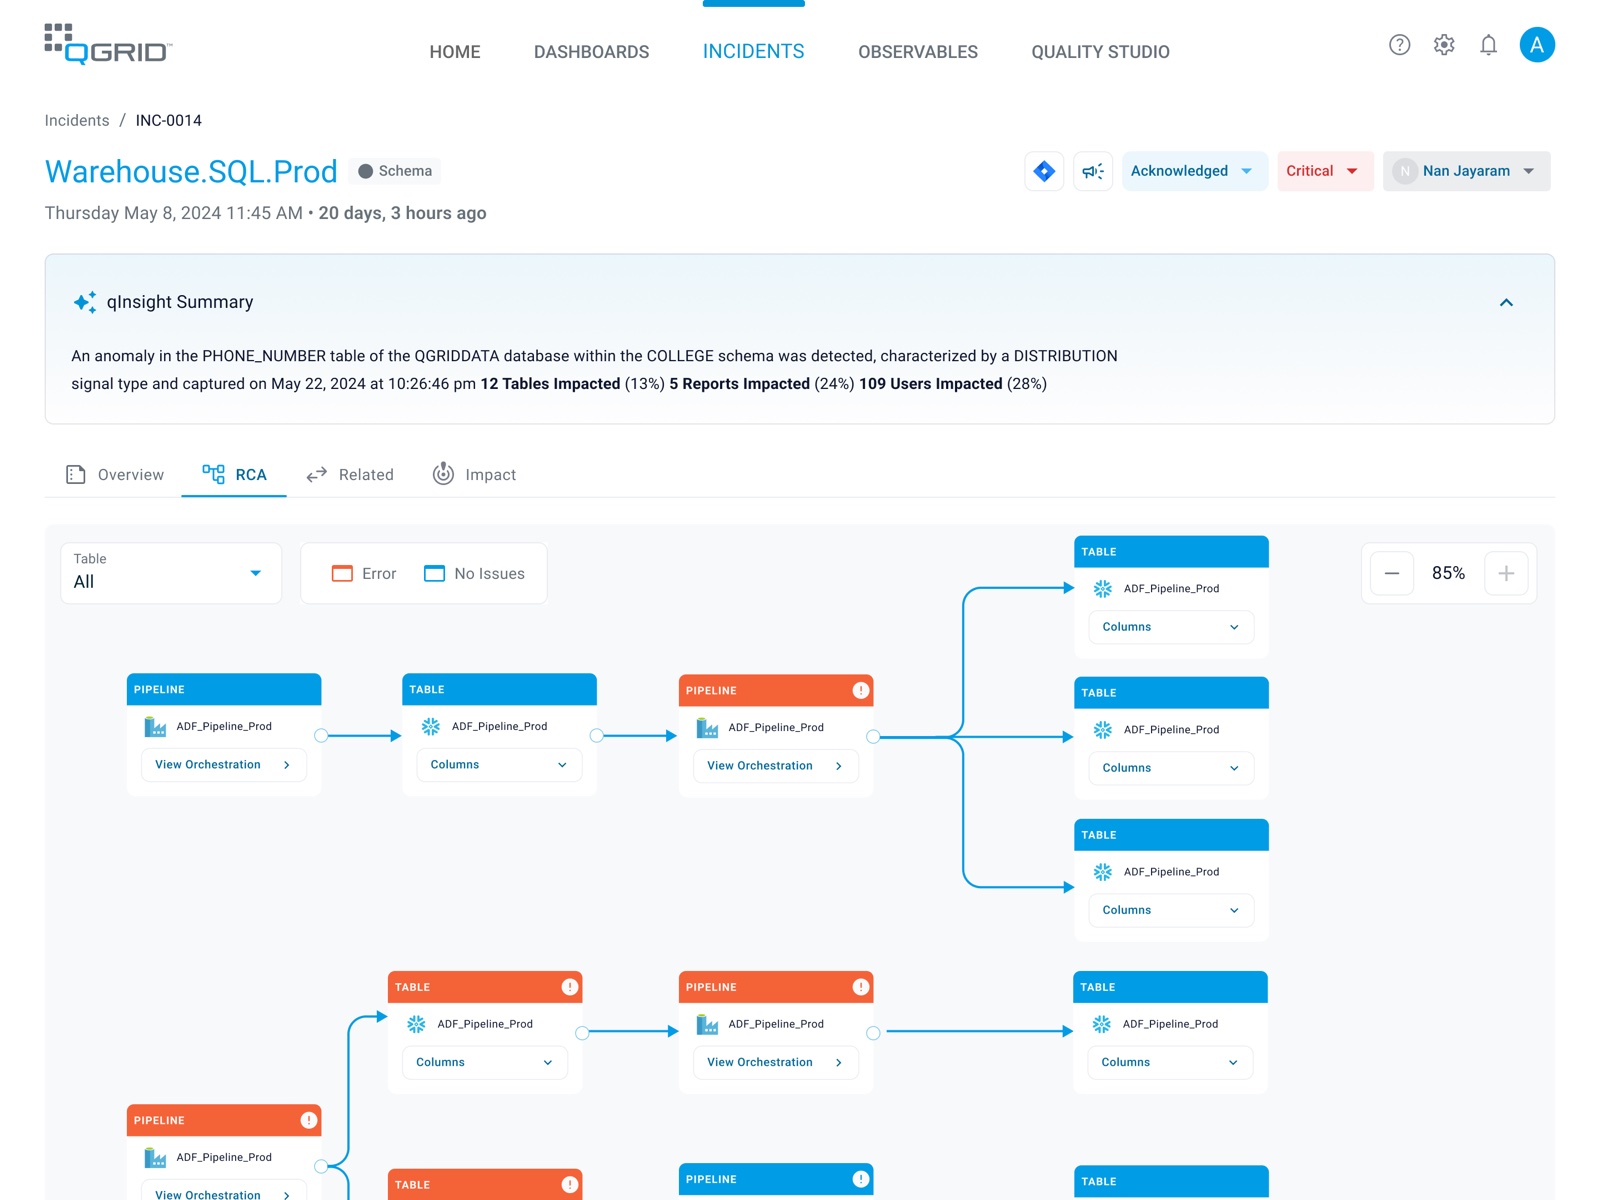
Knowing a table is wrong is only half the job; the other half is finding out why. The RCA tab lays out the pipeline as a lineage graph, with the failing jobs and tables marked, so the break and everything downstream that inherited it are visible at once.
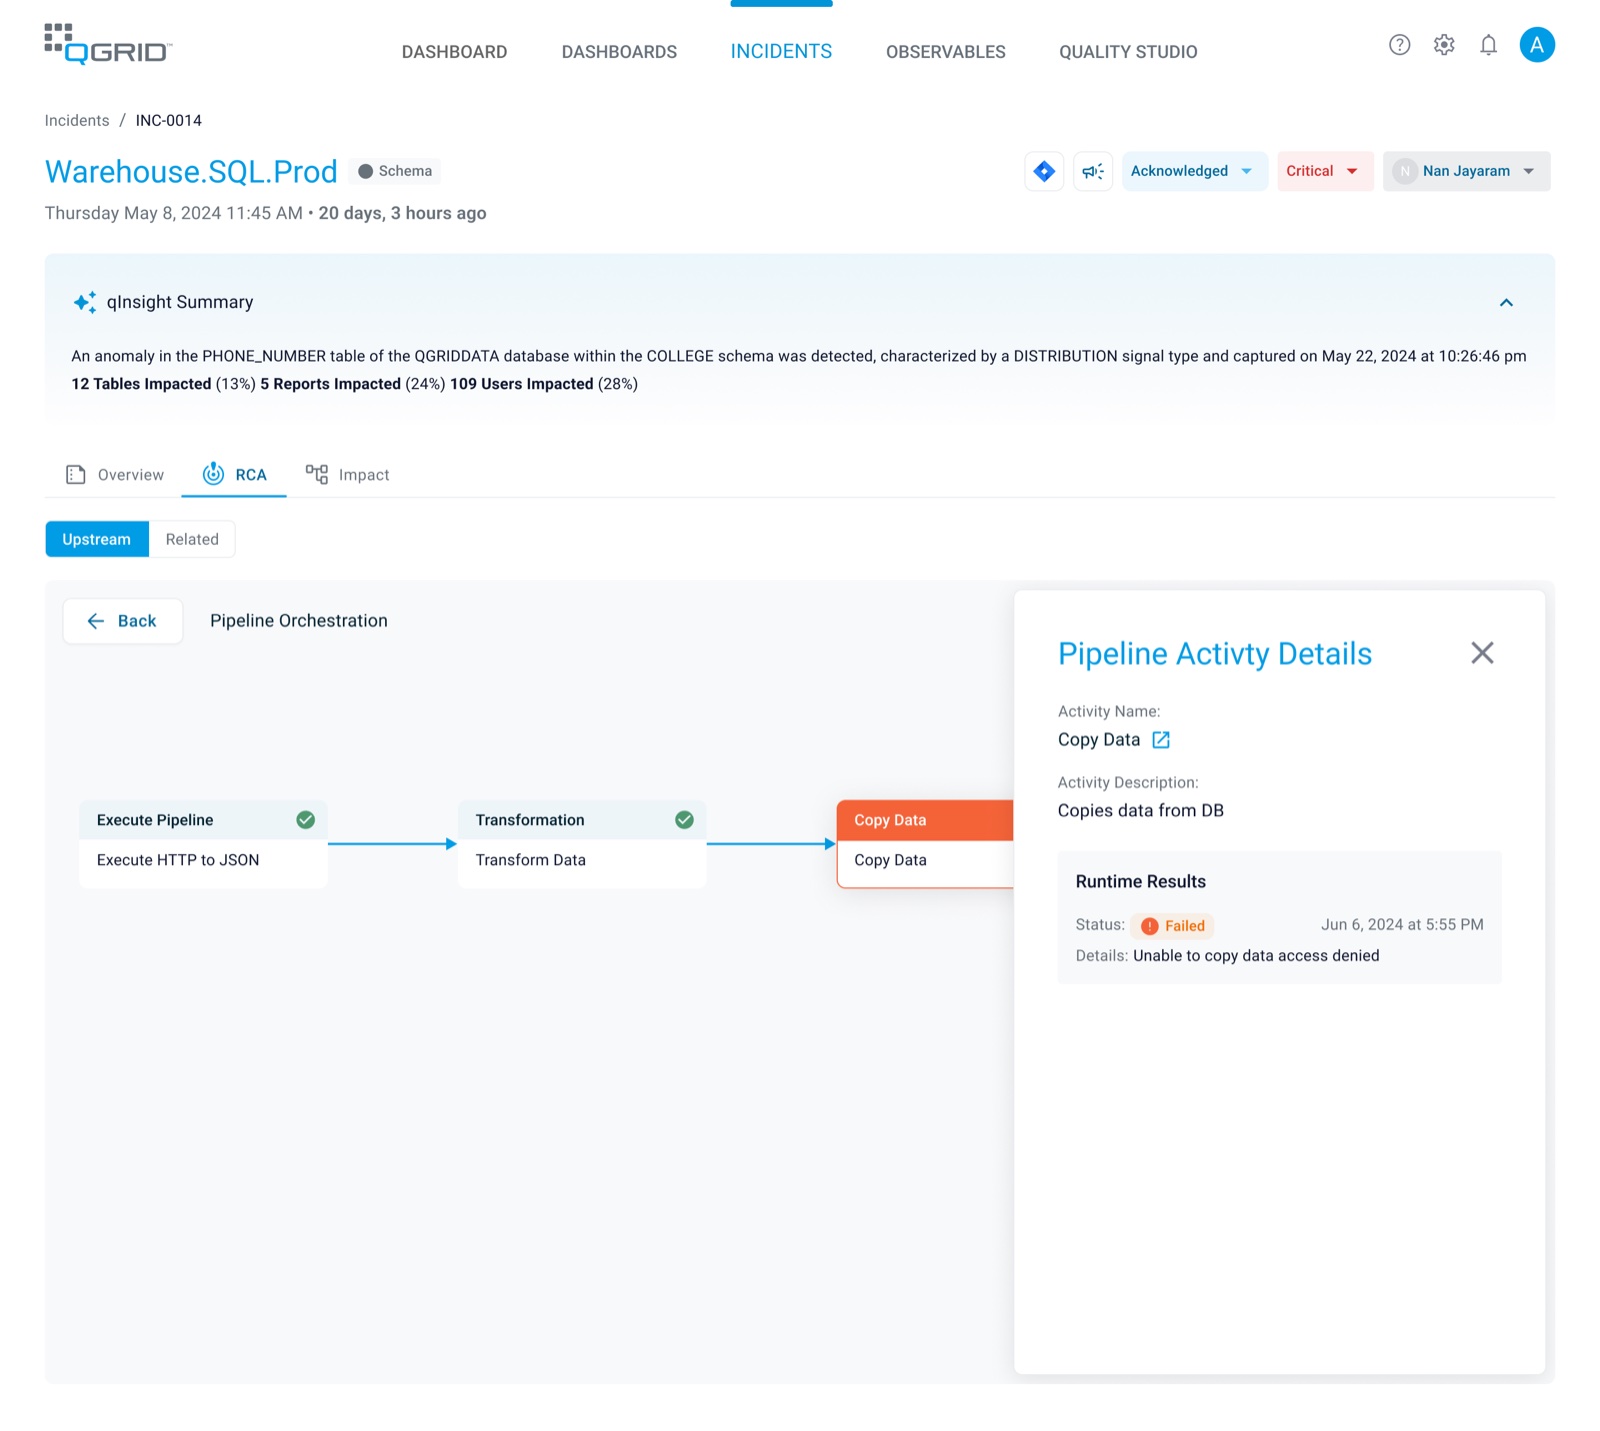
One level deeper, each pipeline opens into its own steps. Here the chain stops at Copy Data, and the step's runtime result gives the reason: access denied.
06
Route
An alert should arrive where the team already works
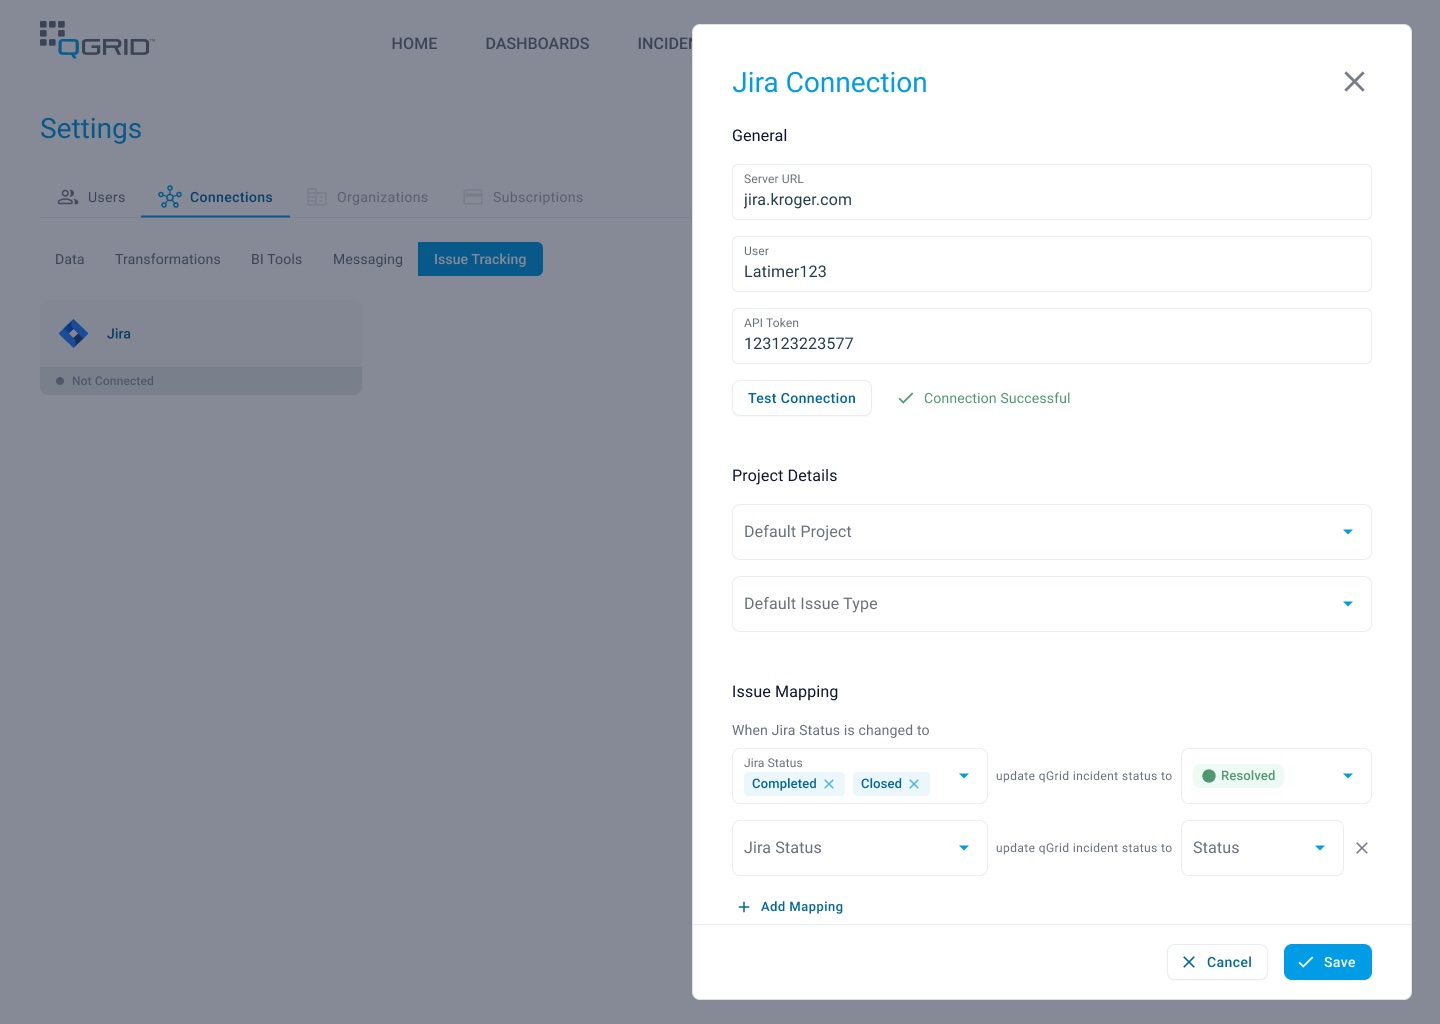
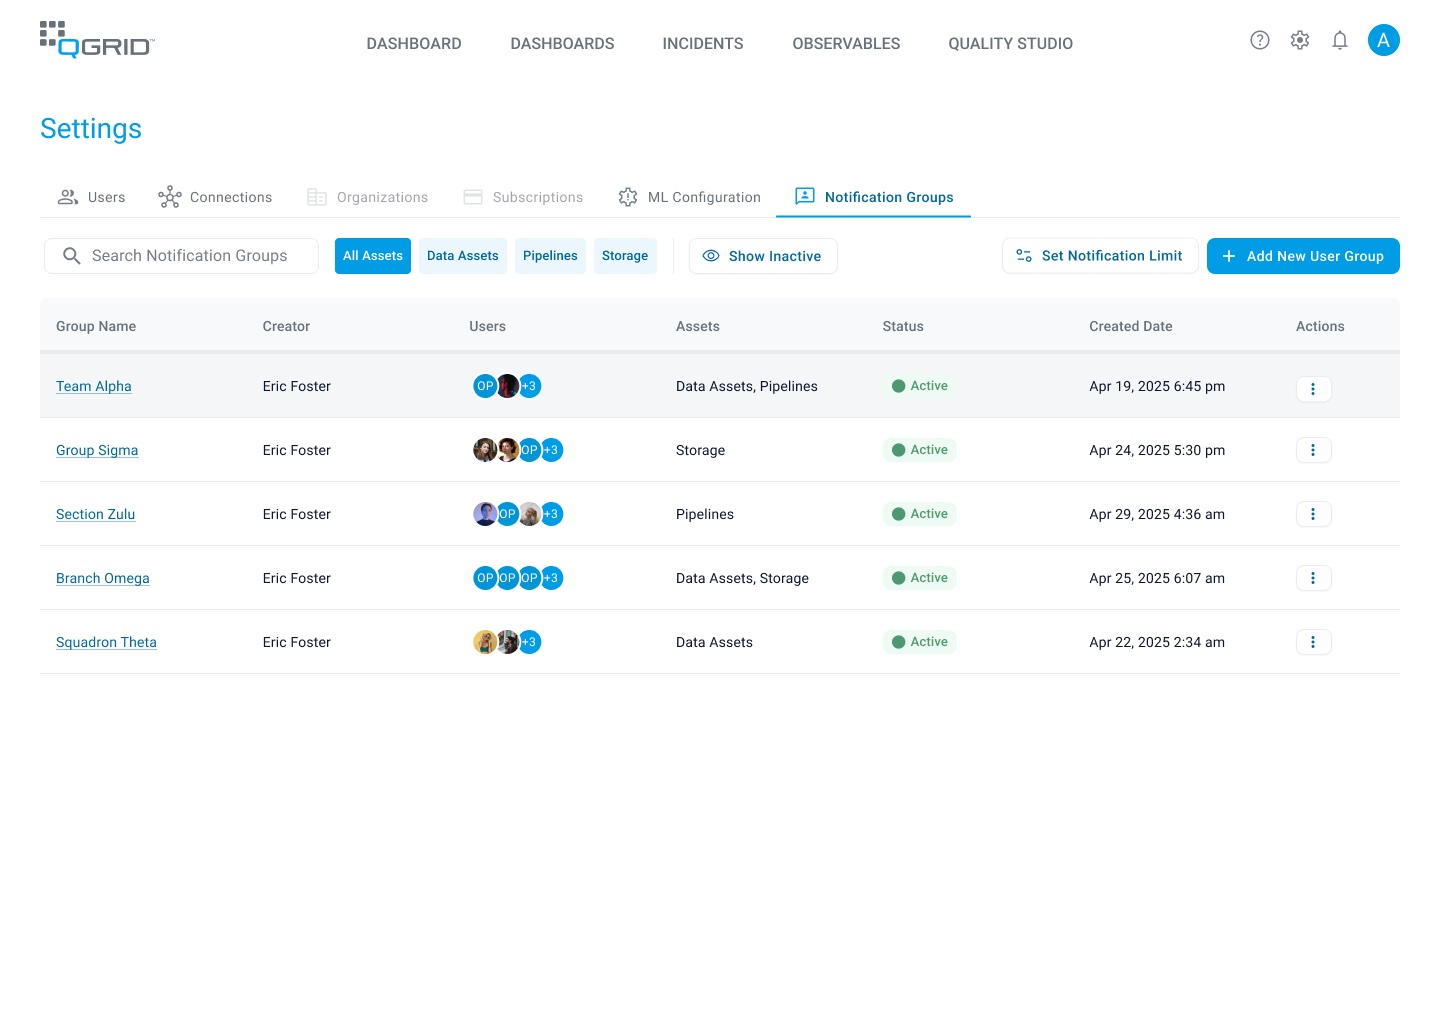
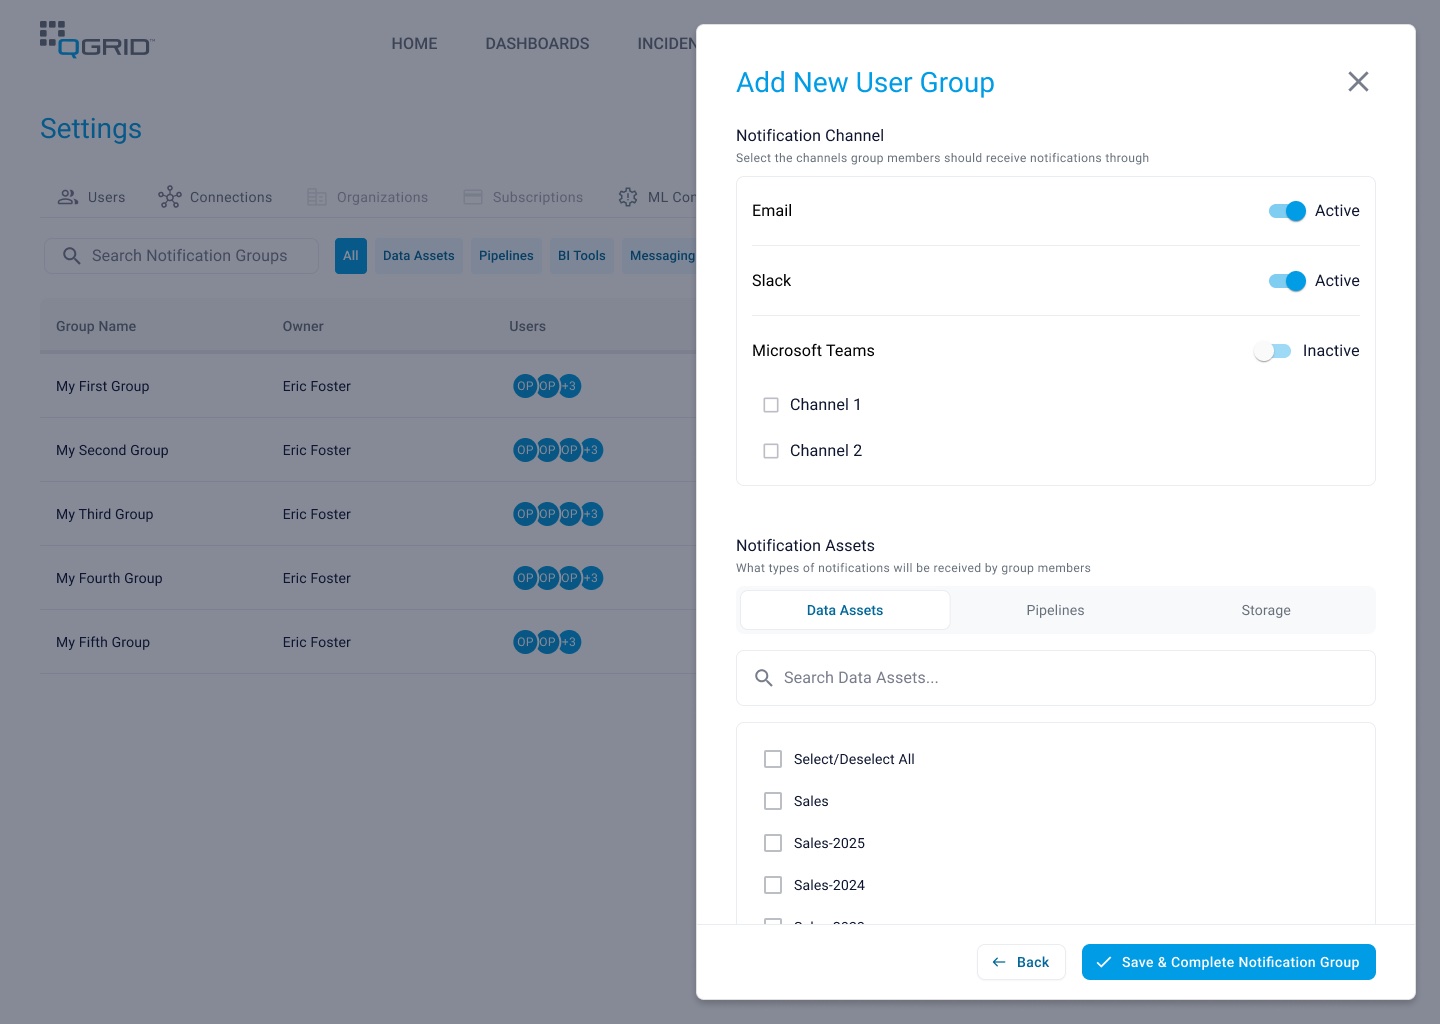
Once the cause is known, the incident needs an owner. It can be sent to Jira in one step, and qGrid keeps the two in sync: when the Jira ticket closes, the incident resolves. Notification groups decide who hears about what, by asset, pipeline or storage, and on which channel: email, Slack or Microsoft Teams.
Fewer alerts, each one carrying its own explanation, beat more alerts every time.
07
Outcome
Proven at enterprise scale, in beta
During the beta, qGrid onboarded the enterprise databases of two major Fortune 500 companies: real production data at the scale the platform was designed for.
2
Fortune 500 companies onboarded during beta
Takeaway
Trust in data is a design problem, not just an engineering one
The models could already find anomalies. What people were missing was a way to understand them: which ones mattered, where they came from, and who needed to know. Following one incident from detection to a closed ticket is what shaped the product.
What I'd carry forward: design for the least technical person in the room, and the experts get a faster tool too.